Bitcoin ETF Outflows Return: $240M Exit After One-Day Rebound—Is BTC Demand Weakening?

 Prefer us on Google

Bitcoin ETF outflows returned on November 17, 2026, as U.S. spot Bitcoin funds recorded $239.9 million in net withdrawals just one trading day after a modest $7.9 million inflow ended a seven-session losing streak. The renewed Bitcoin ETF outflows were led by BlackRock's iShares Bitcoin Trust (IBIT), which lost $209.5 million, according to Farside Investors. The reversal raises an important question: are Bitcoin ETF outflows signaling persistent institutional weakness, or is the market approaching a period of stabilization? This article examines the latest fund-level data, the implications for Bitcoin demand, and the indicators that could help determine BTC's next move.
Key Takeaways
- The rebound was short-lived: U.S. spot Bitcoin ETFs shifted from $7.9 million in net inflows on November 16 to $239.9 million in net outflows on November 17.
- BlackRock's IBIT drove the reversal: The fund moved from a $76.5 million inflow to a $209.5 million outflow across the two sessions.
- The next BTC move remains uncertain: ETF withdrawals indicate weaker net demand through these products, but do not independently determine Bitcoin's future price.
Why Did Bitcoin ETF Outflows Return on November 17?
The November 17 reversal came after a difficult period for U.S. spot Bitcoin ETFs. From November 5 through November 13, the funds recorded seven consecutive trading sessions of net withdrawals, totaling approximately $1.91 billion.
That streak briefly ended on November 16, when BlackRock's IBIT attracted $76.5 million. Although several competing funds continued experiencing withdrawals, IBIT's positive result helped the broader ETF category record a small net inflow.
The recovery did not last.
On November 17, IBIT reported a substantial reversal, while additional redemptions at other funds pushed the overall group back into negative territory.
Bitcoin ETF Flow Data: November 13–17, 2026
| Trading Date | Total Net Flow | BlackRock IBIT | Market Signal |
|---|---|---|---|
| Nov. 13 | -$185.4M | -$143.5M | Seventh consecutive negative session |
| Nov. 16 | +$7.9M | +$76.5M | Brief recovery |
| Nov. 17 | -$239.9M | -$209.5M | Outflows resume |
Source: Farside Investors — U.S. Bitcoin ETF Flows, accessed November 18, 2026. Figures are in U.S. dollars and may be revised.
The difference between November 16 and November 17 was approximately $247.8 million in aggregate daily net flows.
That swing is particularly significant because it occurred immediately after a week of substantial fund withdrawals. It suggests that a single positive session was not sufficient evidence of a sustained recovery in ETF demand.
However, daily flows are volatile, and the data does not establish that institutional investors will continue withdrawing capital at the same pace.

Why Did BlackRock's IBIT Reverse So Sharply?
BlackRock's IBIT has become one of the most closely followed Bitcoin investment products because of its scale and role in connecting traditional brokerage investors with the cryptocurrency market.
On November 16, IBIT's positive inflow was large enough to offset withdrawals from several other funds. The following day, its $209.5 million net outflow became the largest negative contribution to the group's total.
The Two-Day IBIT Reversal
| Indicator | November 16 | November 17 |
|---|---|---|
| IBIT Net Flow | +$76.5M | -$209.5M |
| Total Spot BTC ETF Net Flow | +$7.9M | -$239.9M |
| IBIT Day-over-Day Change | — | -$286.0M |
| Overall ETF Direction | Positive | Negative |
Source: Farside Investors.
The $286 million swing in IBIT's daily net flow illustrates how quickly demand for a major Bitcoin investment vehicle can change.
Nevertheless, these figures do not identify the investors responsible for the redemptions or explain their motives.
Portfolio rebalancing, changes in institutional risk exposure, macroeconomic uncertainty, and capital allocation decisions are all possible explanations. Without investor-level information, assigning the entire outflow to a particular institution or strategy would be speculative.
The broader market context also matters. Bitcoin had already experienced significant selling pressure in November, alongside weaker sentiment in other risk-sensitive assets.
For background on the earlier decline, see WEEX's Bitcoin Falls Toward $70K: ETF Outflows, Liquidations and What Happens Next.
Do Bitcoin ETF Outflows Mean Institutions Are Selling BTC?
Not necessarily in the simple way that the headline might suggest.
Spot Bitcoin ETFs generally provide exposure to Bitcoin through fund shares backed by Bitcoin holdings. When investors redeem shares, the fund's creation and redemption process can affect the amount of Bitcoin held by the vehicle.
However, daily ETF net flows should not be interpreted as an exact measurement of Bitcoin sold on exchanges at the same moment.
The underlying transactions may involve authorized participants, intermediaries, liquidity providers, and different settlement arrangements.
Furthermore, a net outflow from U.S. spot ETFs does not mean every institutional investor is selling Bitcoin.
Institutions can hold BTC through direct custody, other investment vehicles, derivatives, or privately managed products.
ETF flow data therefore represents an important but incomplete picture of institutional demand.
What ETF Flow Data Can and Cannot Tell Us
| Indicator | What It Can Show | What It Cannot Prove |
|---|---|---|
| Daily ETF Net Flow | Net capital entering or leaving tracked funds | Direction of all institutional Bitcoin holdings |
| IBIT Net Flow | Changes in one major investment product | Identity or motivation of investors |
| Consecutive Outflow Sessions | Persistence of negative demand through ETFs | A guaranteed continuation of BTC price declines |
| ETF Assets Under Management | Approximate scale of tracked fund assets | Exact daily investor purchases |
| BTC Spot Trading Volume | Market trading activity | Whether all volume reflects long-term accumulation |
These distinctions are essential when interpreting institutional activity.
A large withdrawal can coincide with declining BTC prices, but the relationship is influenced by liquidity, derivatives positions, market expectations, and broader economic conditions.
Readers who want to examine fund data alongside market information can use the WEEX Crypto ETF Tracker.
For additional background on how ETF activity relates to market levels, see Bitcoin ETF Flows: How to Identify BTC Support & Resistance.
-- Price
Could Bitcoin ETF Outflows Push BTC Prices Lower?
Continued ETF withdrawals could create another source of pressure if demand elsewhere in the market is insufficient to absorb available supply.
However, Bitcoin's price is determined by the interaction of buyers and sellers across spot markets, derivatives exchanges, and other investment channels.
The size of ETF withdrawals alone cannot determine a specific BTC price target.
Three potential scenarios are worth monitoring.
Scenario 1: ETF Outflows Continue
If major funds record additional negative sessions, concerns about institutional demand could intensify.
Under this scenario, traders would need to evaluate whether spot-market liquidity and other forms of buying demand are sufficient to absorb the withdrawals.
Scenario 2: ETF Flows Stabilize
If the daily withdrawals become smaller or alternate with positive sessions, the market may begin interpreting the flow data as evidence of stabilization.
This would not automatically establish a bullish trend, but it could reduce one source of uncertainty.
Scenario 3: Sustained Net Inflows Return
Several consecutive sessions of positive ETF flows would provide stronger evidence of renewed demand than a single positive day.
The quality of the recovery would also depend on whether inflows are concentrated in IBIT or distributed across multiple funds.

What Should BTC Traders Watch Next?
Rather than focusing exclusively on the latest withdrawal figure, market participants should monitor the relationship between fund flows and underlying BTC price behavior.
An improving ETF trend becomes more informative when accompanied by stronger spot-market participation, greater liquidity, and a reduction in disorderly liquidations.
Conversely, a temporary price rebound during continued ETF withdrawals may deserve closer examination, particularly if derivatives leverage is increasing.
Four Indicators That Matter
| Indicator | What to Monitor | Why It Matters |
|---|---|---|
| ETF Net Flows | Consecutive positive or negative sessions | Helps identify the direction of fund demand |
| IBIT Activity | Whether large redemptions continue | Shows changes in a major fund |
| BTC Spot Volume | Volume during rebounds and declines | Helps assess participation behind price moves |
| Futures Positioning | Funding rates, open interest, liquidations | Identifies potential leverage-related volatility |
These indicators should be interpreted together rather than independently.
Historical ETF flows provide useful context, but they are not a reliable standalone trading signal.
How to Buy and Trade Bitcoin (BTC) on WEEX
WEEX provides Bitcoin spot and perpetual futures market interfaces for eligible users. Both can be used to monitor BTC market conditions, although their mechanics and risks differ.
Step 1: Register and Prepare Your Trading Account
Visit WEEX and sign in or create an account. Complete any applicable identity verification requirements and prepare a supported trading balance.
Before depositing assets, verify the relevant blockchain network, deposit address, and applicable fees.
Step 2: Access BTC Spot Trading
Open the BTC/USDT Spot Trading page.
Review the current order book, available balance, supported order types, and market conditions. Select a market or limit order and enter the amount before confirming.
Spot trading provides exposure through the purchased BTC balance, subject to the platform's applicable trading and custody arrangements.
Step 3: Confirm Your Order and Monitor the Market
After execution, verify the transaction history and account balance.
Experienced derivatives traders may separately review BTC/USDT Perpetual Futures, where available. Perpetual futures involve additional considerations, including leverage, funding payments, margin requirements, and liquidation risk. Check the current contract status and any trading restrictions before attempting an order.
Conclusion
The return of Bitcoin ETF outflows on November 17 illustrates how fragile short-term improvements in institutional fund demand can be.
After a brief $7.9 million inflow on November 16, U.S. spot Bitcoin ETFs recorded $239.9 million in net withdrawals, with BlackRock's IBIT accounting for the largest negative move.
The figures indicate that institutional demand through these particular investment products has not yet demonstrated a sustained recovery.
Nevertheless, ETF flows represent only one component of Bitcoin's broader market structure.
The next several trading sessions, alongside spot liquidity, derivatives positioning, and investor risk appetite, will help determine whether the latest reversal develops into persistent pressure or gives way to stabilization.
FAQ
1. Why did Bitcoin ETF outflows return on November 17, 2026?
U.S. spot Bitcoin ETFs recorded $239.9 million in net outflows on November 17, according to Farside Investors. BlackRock's IBIT contributed $209.5 million in net withdrawals, reversing its positive performance from the previous session.
2. How much money did BlackRock's IBIT lose on November 17?
IBIT recorded $209.5 million in net outflows, following a $76.5 million inflow on November 16. The two sessions represent a $286 million change in the fund's daily net flow.
3. Do Bitcoin ETF outflows always cause BTC prices to fall?
No. ETF withdrawals can influence the balance of demand and supply, but Bitcoin prices also depend on spot-market activity, liquidity, derivatives positioning, and broader economic factors.
4. Are institutions abandoning Bitcoin in November 2026?
The ETF data shows substantial withdrawals from U.S. spot Bitcoin investment funds, but it does not establish that all institutions are selling their Bitcoin holdings. Investors may use other custody arrangements and investment vehicles.
5. Where can investors track Bitcoin ETF flows?
Farside Investors publishes historical fund-level net flow figures, while the WEEX ETF Tracker provides an additional market-information interface. Readers should verify timestamps and data coverage before comparing different sources.
This content is provided for general informational purposes only and doesn't constitute financial, investment, legal, or tax advice. Any events, rewards, online promotions, or related information mentioned herein should not be considered a recommendation, solicitation, or invitation to purchase, sell, trade, or otherwise deal in any crypto assets. Crypto assets are highly volatile and may result in loss. The availability of WEEX services, products, and related events may vary by region. You are responsible for ensuring that your participation is in accordance with applicable local laws and regulations.
You may also like

How to Become a WEEX Elite Trader: Levels, Rules and Profit Share

WEEX Copy Trading Slippage: How to Set the 0.1% to 1% Limit

Are WEEX Copy Traders' PnL Figures Real? How to Read the Numbers

Where Does WEEX Rank Among Futures Copy Trading Platforms?

Copy Trading Platforms for Small Investments: $10 vs $100 Minimum

ChatGPT Wallet Skips Crypto: What It Means for AI Agent Payments

Bitcoin Miners Hijacked: How 64,000 Rigs Were Pointed at OCEAN

Anthropic IPO: ANT Prices Nov. 18 at $70-$78, What It Means

USOR vs USOE: Are Oil-Themed Tokens Backed by Real Oil?

Are Bitcoin Lightning Wallets Safe? 5 Security Warnings Since August

Anthropic IPO: ANT Date, Price Range and Valuation

Powell Speech Bitcoin: Why Warsh, Not Powell, Moves BTC in 2026

Fed Rate Cut December 2026? Why Markets Now Price a Hike Instead

Fed Rate Decision Bitcoin: How BTC Reacted to Every 2026 Call

BTC Staking in a Crash: What It Protects and What It Does Not

Bitcoin Falls Toward $70K: ETF Outflows, Liquidations and What Happens Next

December FOMC Meeting 2026: Dec. 8-9 Rate Hike, 25 or 50 Bps?

CPI Release Date: Next Report Dec. 10, 2026 at 8:30 a.m. ET

November CPI Report: Dec. 10 Release Lands After the Fed Decides

Midterm Election Results Crypto: Who Now Controls Crypto Policy

Midterm Elections Bitcoin Price: What 2014, 2018 and 2022 Show

What Is Project Faro? The $270M Bank Stablecoin Plan Explained

Stablecoin Supply Falls $14.2B in 30 Days: What It Means for Bitcoin
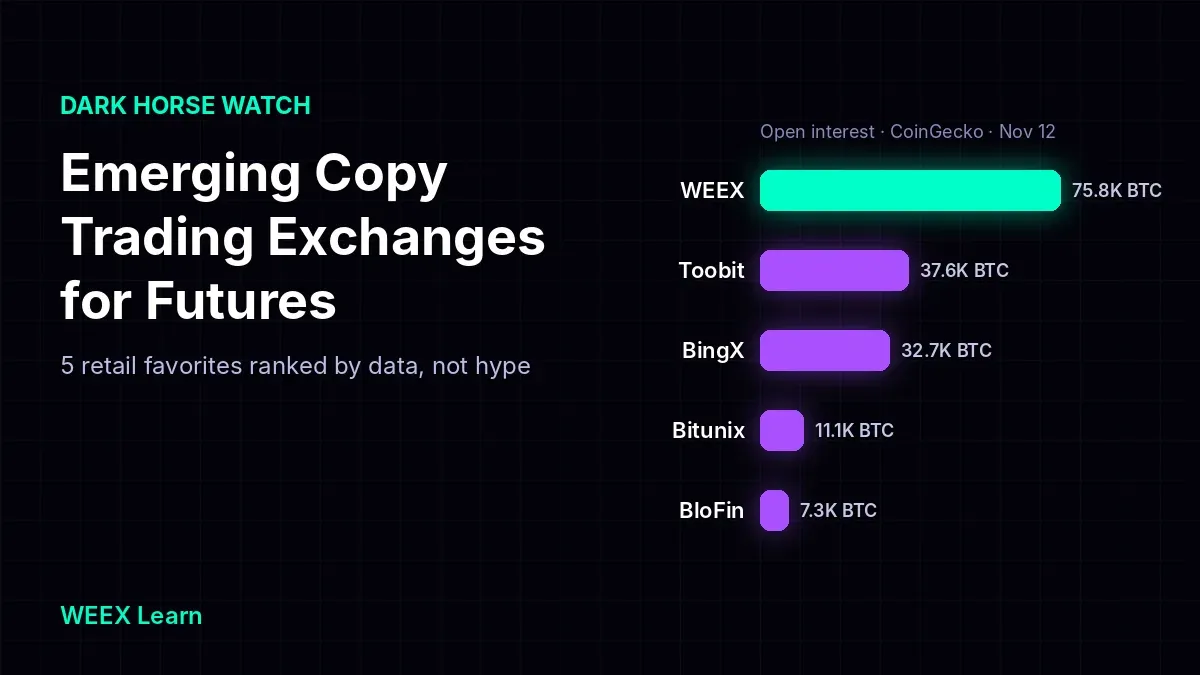
Emerging Copy Trading Exchanges for Futures: 5 Retail Favorites

Copy Trading With No Extra Fees: Which Exchanges Really Qualify?

Beginner-Friendly Crypto Exchanges With Simple Interfaces Ranked

Low-Fee Futures Exchanges That Are Easy to Use: 2026 Cost Test

Is WEEX Safe? Proof of Reserves, 1,000 BTC Fund and Licences Checked (2026)

Bitcoin After Hot CPI: Why December Rate Hike Odds Hit 85%

What Is GRAM? Price Rebounds After Falling Below $1, Telegram Wallet Data and What Is Confirmed
How to Become a WEEX Elite Trader: Levels, Rules and Profit Share
WEEX Copy Trading Slippage: How to Set the 0.1% to 1% Limit
Are WEEX Copy Traders' PnL Figures Real? How to Read the Numbers
Where Does WEEX Rank Among Futures Copy Trading Platforms?
Copy Trading Platforms for Small Investments: $10 vs $100 Minimum
ChatGPT Wallet Skips Crypto: What It Means for AI Agent Payments
Contents
Popular coins
Latest articles