- Mua crypto
- Thị trường
- Futures
- Spot
- Sao chép giao dịch
 WE-Launch
Historical B/S Indicators for Candlestick Charts
By: WEEX|2025/10/22 10:17:20
WEEX just got smarter! Review past trades and refine your strategies with our brand-new feature: Historical B/S (Buy/Sell) markers for candlestick charts! Now, you can view your past trades right on the chart, helping you make sharper decisions and trade more efficiently.
Highlights
- Trade records at a glance
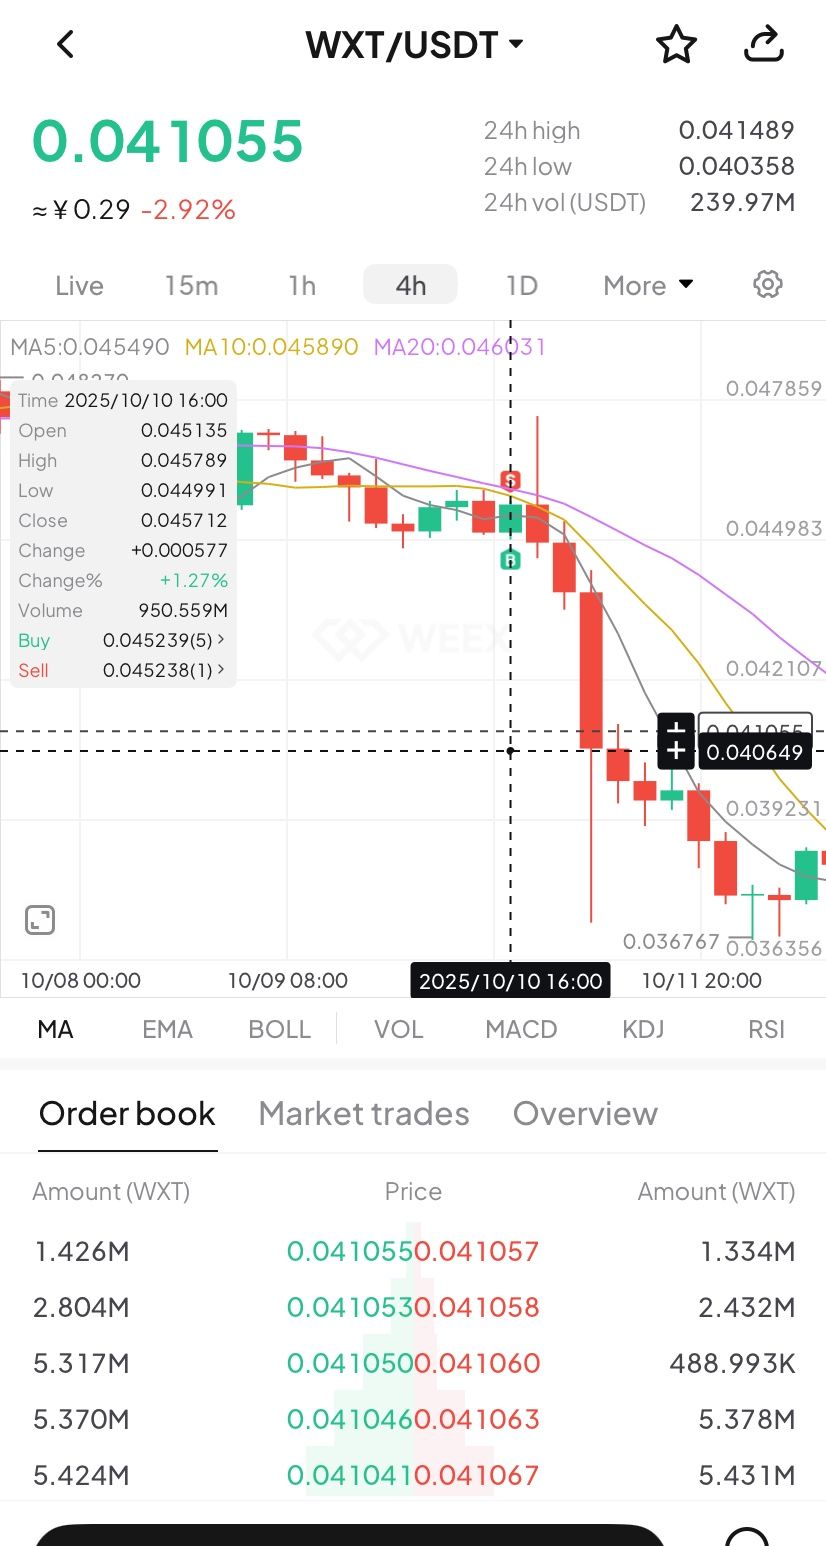
- Your Buy (B) and Sell (S) points are automatically marked on the chart.
- Each marker shows your precise trade time and price, helping you review past orders at a glance.
- Comprehensive coverage
- Spot trading: Full support for marking trades across all spot pairs.
- Futures trading: Clearly shows open and close points, distinguishing between long and short positions.
- Rich interactions
- Tap any marker (B or S) to view detailed trade information, such as:
- Trade time: Review exact trade times and corresponding market conditions.
- Execution price: Displays the average filled price of historical trades.
- Trade count: Quickly check the number of trades in a certain period.
- Markers update dynamically as you zoom and drag the candlestick. Seamlessly review up to 100 executed trades from the last 90 days.
- Universal access
- Available on both iOS and Android: Access your trade history anytime, on any mobile device.
- Full currency coverage: Supports all pairs in your portfolio, across both spot and futures markets.
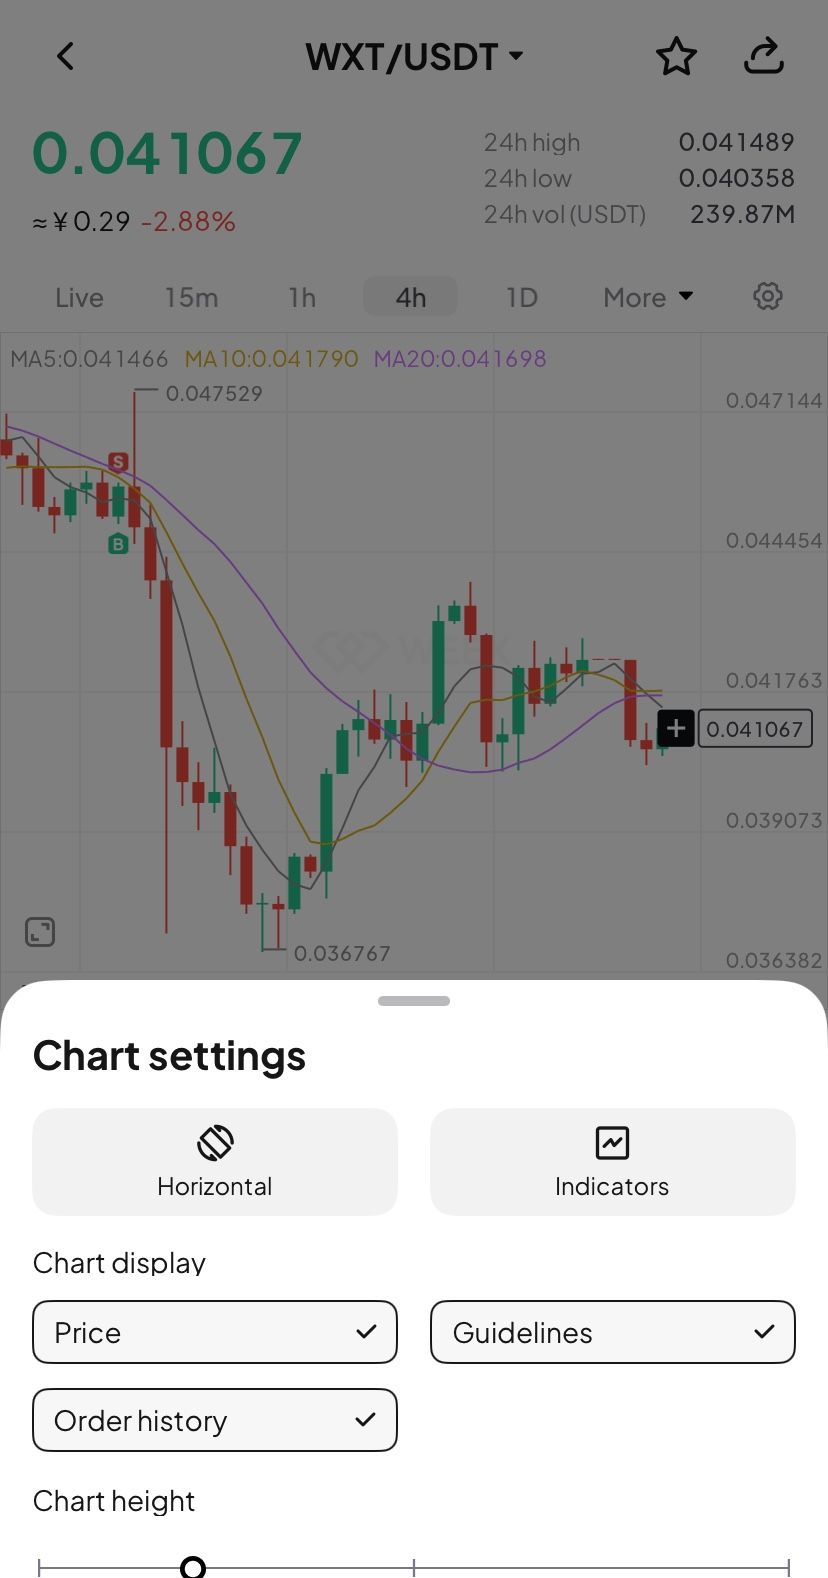
How to Use?
- Open the WEEX app and go to any pair's chart page.
- Tap the candlestick chart and enable the "Order history" feature in the chart settings (enabled by default.)
- If trades exist for that pair, B and S markers will instantly show up on the chart.
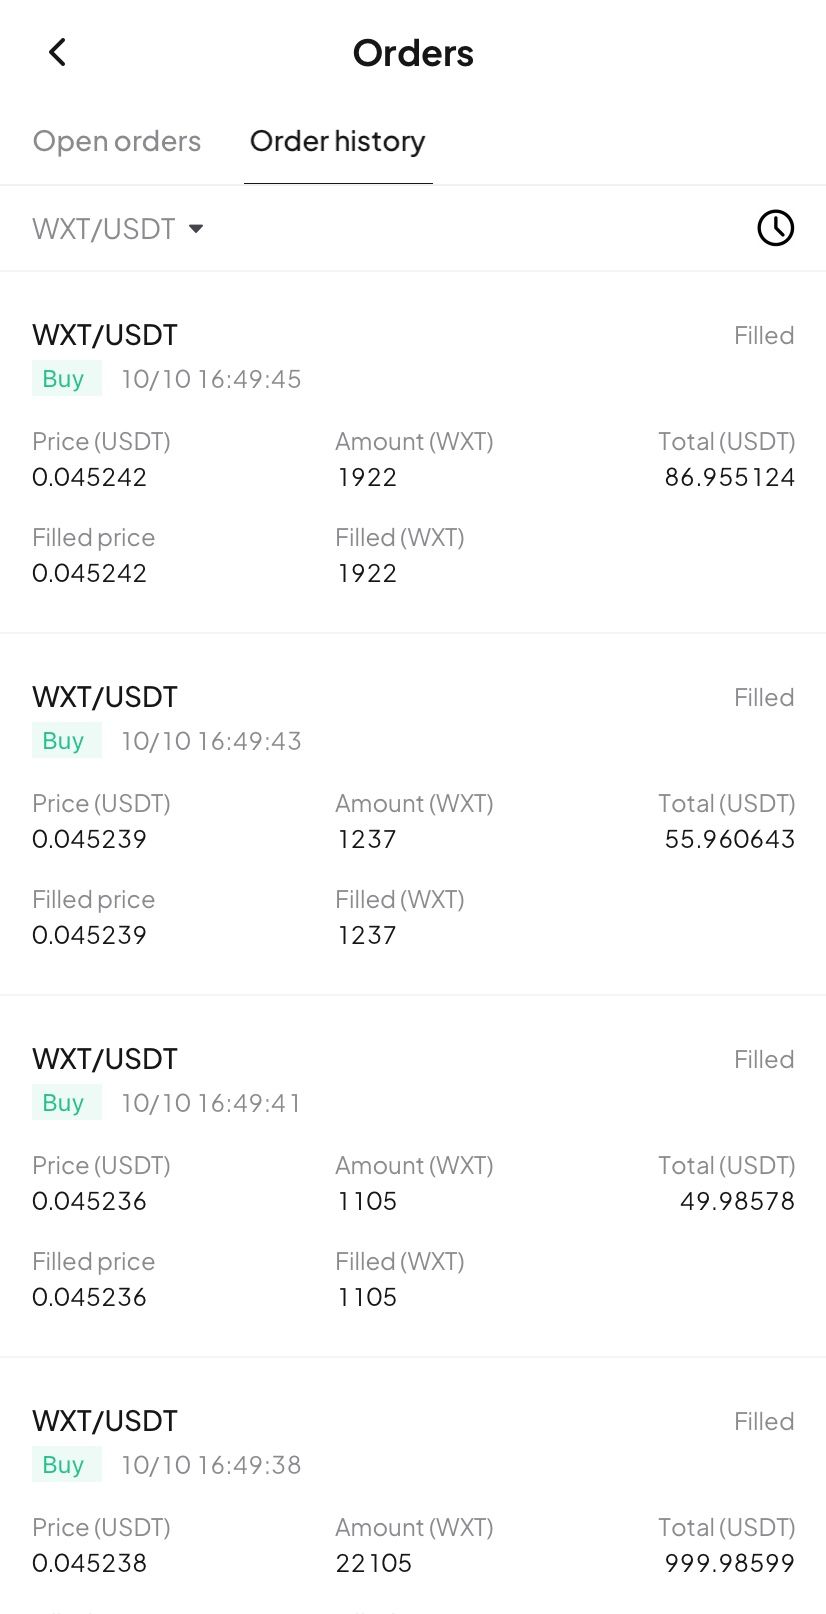
- Tap any marker to check the full details of that transaction.
Where to use it
- Review strategies: Quickly review your buy and sell points combined with market trends to refine your strategy.
- Analyze PnL: Easily pinpoint profitable or losing trades to learn from your past performance.
Understand trends: Combine your trade history with the candlestick chart data for deeper market and behavioral analysis.
Feature preview
- On/off toggle: Use the "Settings" icon to switch the "Order History" feature on or off (enabled by default).
- B (Buy) marker: Green marker showing your exact buy action.
- S (Sell) marker: Red marker identifying every sell transaction.
- Details pop-up: Tapping the marker brings up a card with key data (time, price, and count).
- Full breakdown: Tap the details card to open the "Order History" page and view your trading record.
Try now
Update your WEEX app to the latest version to experience our new Buy/Sell markers! Gain clarity and transparency in your trades, empowering smarter investment decision!
Vốn hóa thị trường của đồng tiền meme "Solara" đã vượt quá 20 triệu đô la Mỹ trong thời gian ngắn, lập kỷ lục mới
Limitless công bố nền kinh tế mã thông báo LMTS, với airdrop và ưu đãi chiếm 24,37%
Bạn cũng có thể thích
Chia sẻ
Tăng
Tin tức crypto mới nhất
16:18
Một cá voi đã bán khống ASTER với đòn bẩy 3x, trị giá khoảng 18,81 triệu đô la và hiện đang chịu khoản lỗ trên giấy tờ là 980.000 đô la.
16:18
Con cá voi đã bán khống 42,966 triệu token ASTER đã thu được lợi nhuận, với mức lãi chưa thực hiện hiện tại đạt 1,2 triệu đô la.
15:48
Một cá voi đã bán khống ASTER với đòn bẩy 3x, trị giá khoảng 52,94 triệu đô la.
15:48
CZ trả lời về "Đợt tăng giá ngắn hạn của ASTER": Ban đầu tôi muốn mua thêm khi giá còn thấp.
15:18
"Cá voi có tỷ lệ thắng 100%" đã đặt thêm một lệnh mua SOL trị giá 2,45 triệu đô la, nâng tổng số SOL nắm giữ lên 110 triệu đô la.
Đọc thêm
Cộng đồng
Chăm sóc khách hàng:@weikecs
Hợp tác kinh doanh:@weikecs
Giao dịch Định lượng & MM:bd@weex.com
Dịch vụ VIP:support@weex.com