- 暗号資産の購入
- 市場
- 先物
- 現物
- コピートレード
 WE-Launch
Historical B/S Indicators for Candlestick Charts
By: WEEX|2025/10/22 10:17:20
WEEX just got smarter! Review past trades and refine your strategies with our brand-new feature: Historical B/S (Buy/Sell) markers for candlestick charts! Now, you can view your past trades right on the chart, helping you make sharper decisions and trade more efficiently.
Highlights
- Trade records at a glance
- Your Buy (B) and Sell (S) points are automatically marked on the chart.
- Each marker shows your precise trade time and price, helping you review past orders at a glance.
- Comprehensive coverage
- Spot trading: Full support for marking trades across all spot pairs.
- Futures trading: Clearly shows open and close points, distinguishing between long and short positions.
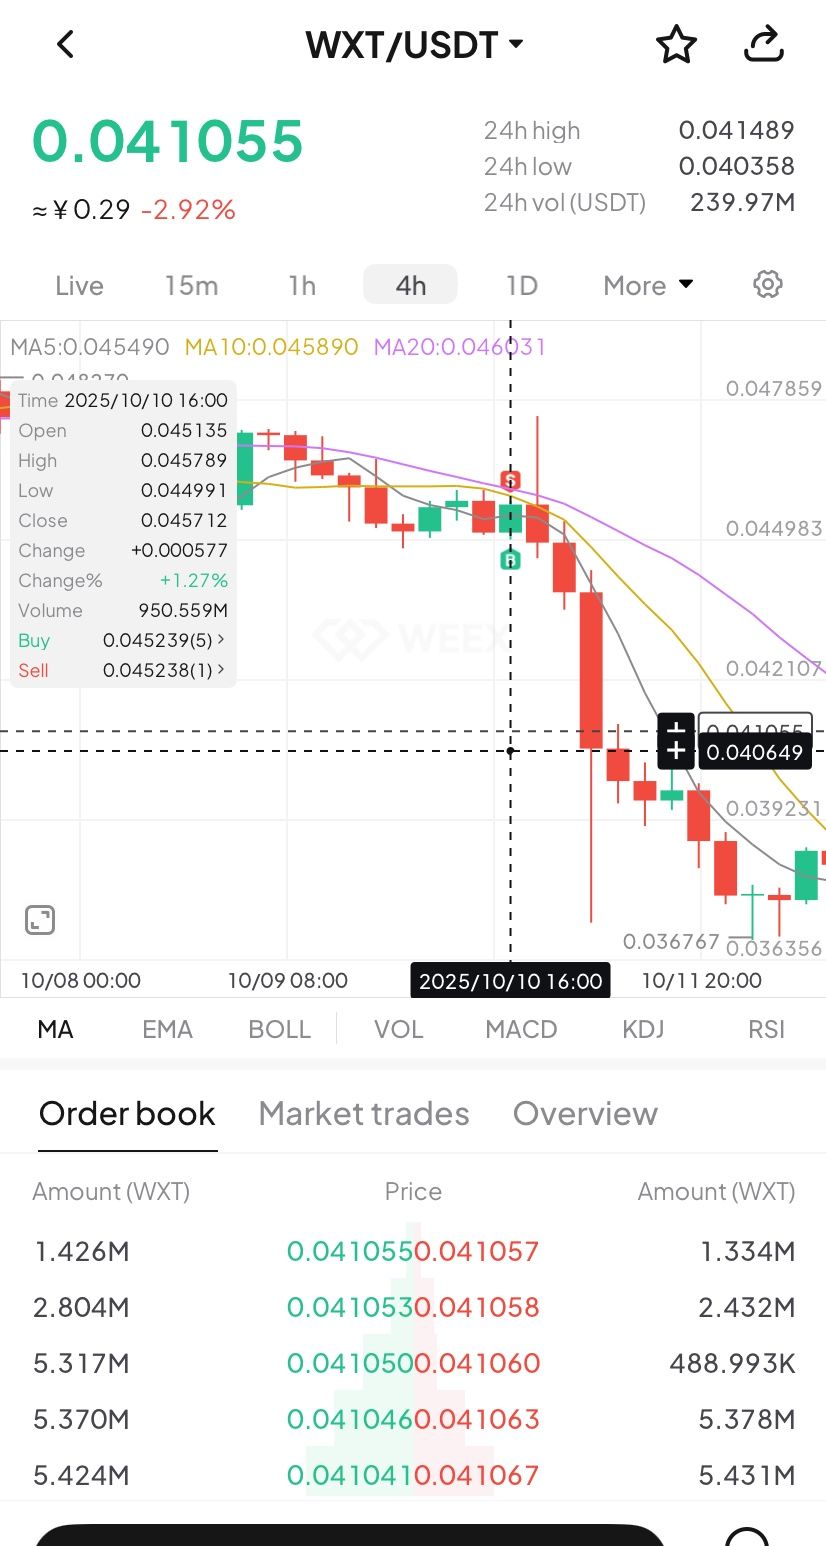
- Rich interactions
- Tap any marker (B or S) to view detailed trade information, such as:
- Trade time: Review exact trade times and corresponding market conditions.
- Execution price: Displays the average filled price of historical trades.
- Trade count: Quickly check the number of trades in a certain period.
- Markers update dynamically as you zoom and drag the candlestick. Seamlessly review up to 100 executed trades from the last 90 days.
- Universal access
- Available on both iOS and Android: Access your trade history anytime, on any mobile device.
- Full currency coverage: Supports all pairs in your portfolio, across both spot and futures markets.
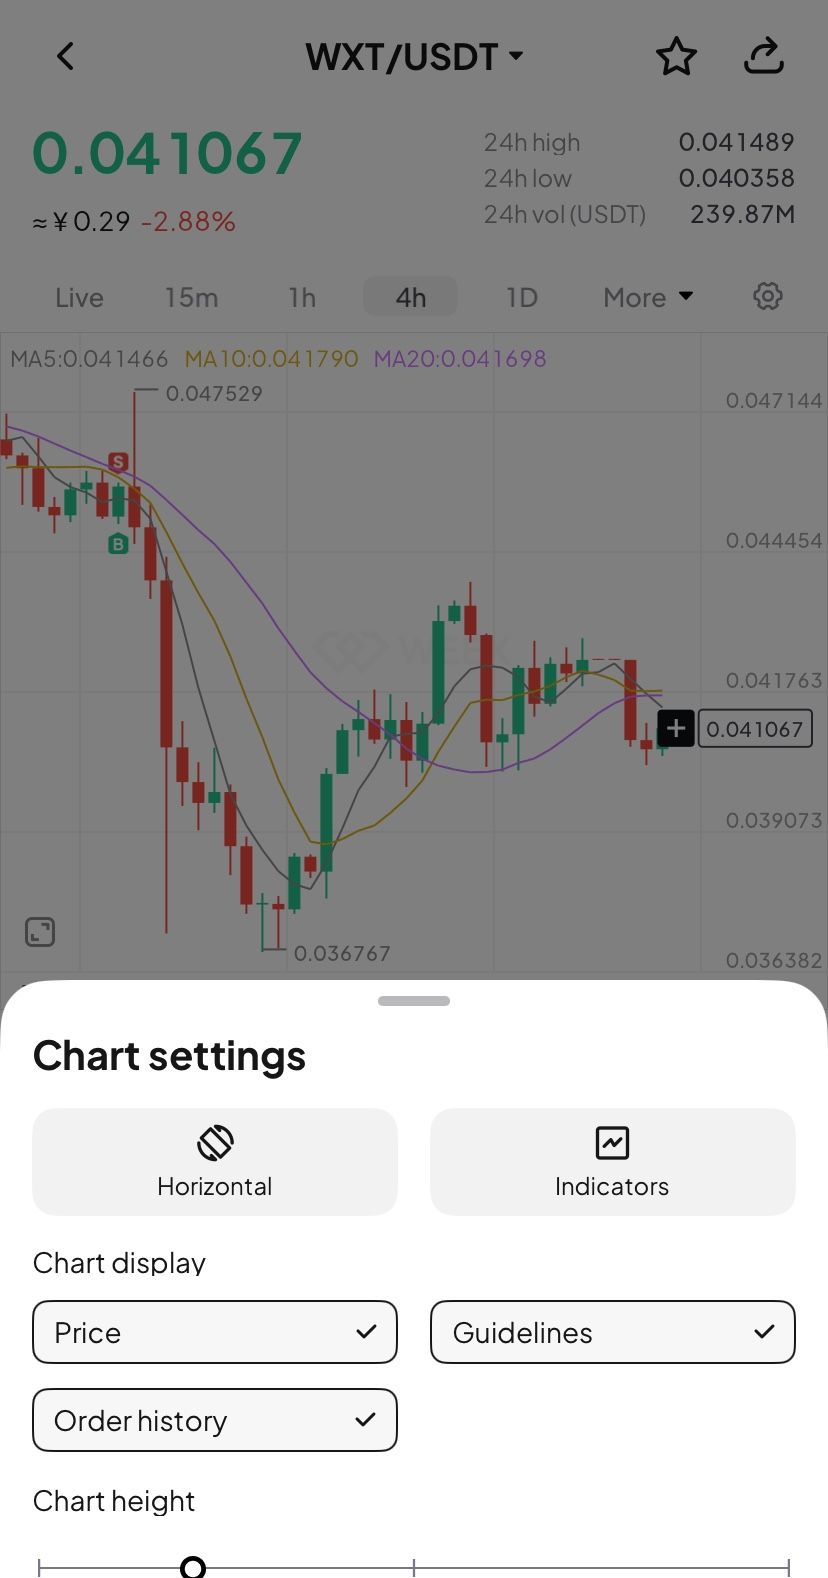
How to Use?
- Open the WEEX app and go to any pair's chart page.
- Tap the candlestick chart and enable the "Order history" feature in the chart settings (enabled by default.)
- If trades exist for that pair, B and S markers will instantly show up on the chart.
- Tap any marker to check the full details of that transaction.
Where to use it
- Review strategies: Quickly review your buy and sell points combined with market trends to refine your strategy.
- Analyze PnL: Easily pinpoint profitable or losing trades to learn from your past performance.
Understand trends: Combine your trade history with the candlestick chart data for deeper market and behavioral analysis.
Feature preview
- On/off toggle: Use the "Settings" icon to switch the "Order History" feature on or off (enabled by default).
- B (Buy) marker: Green marker showing your exact buy action.
- S (Sell) marker: Red marker identifying every sell transaction.
- Details pop-up: Tapping the marker brings up a card with key data (time, price, and count).
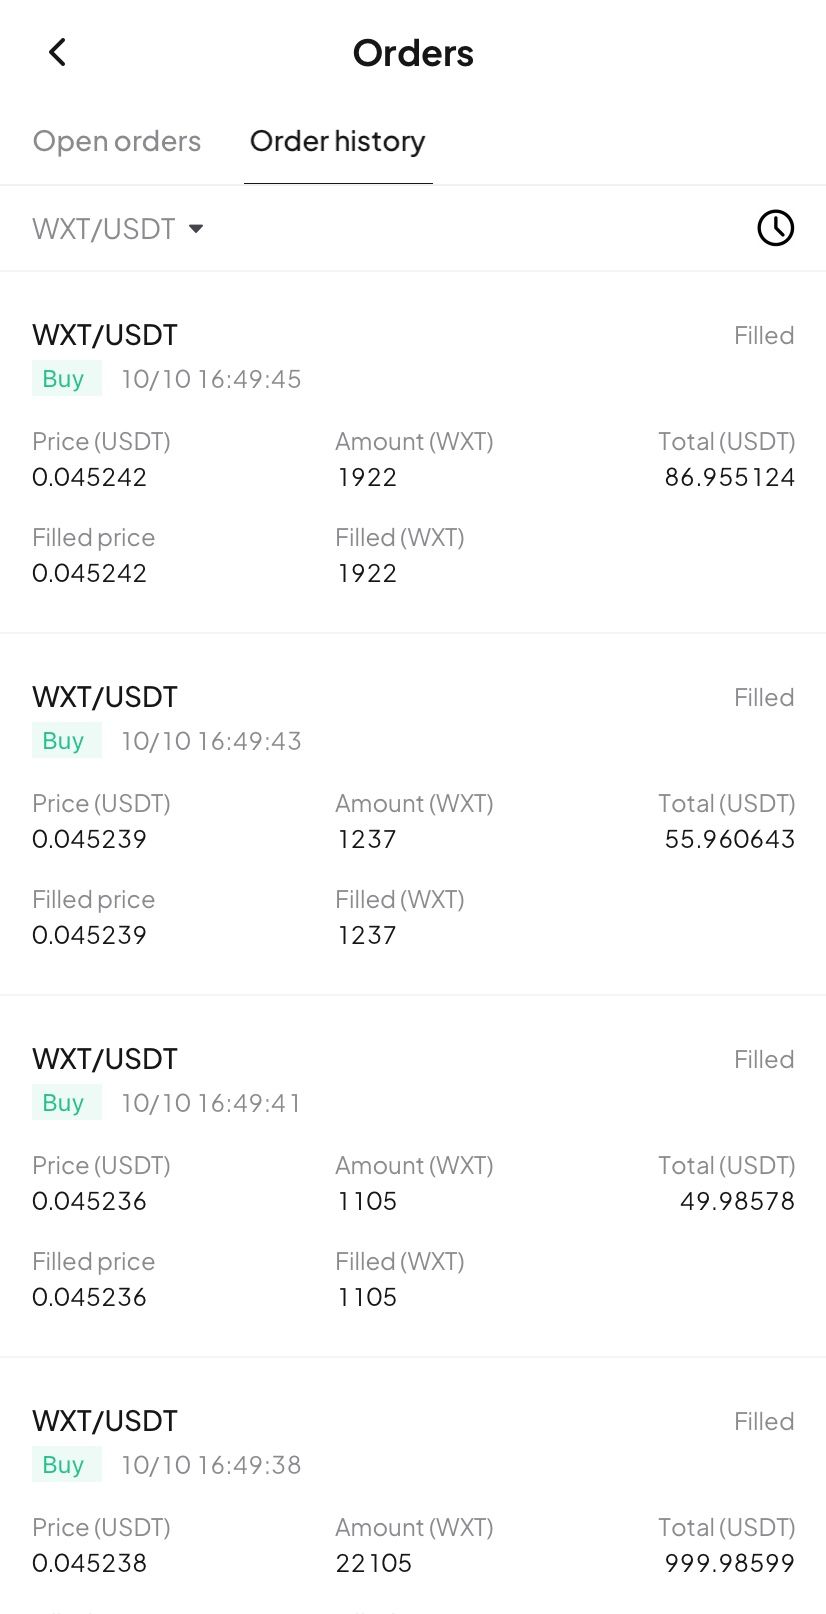
- Full breakdown: Tap the details card to open the "Order History" page and view your trading record.
Try now
Update your WEEX app to the latest version to experience our new Buy/Sell markers! Gain clarity and transparency in your trades, empowering smarter investment decision!
「1011インサイダーホエール」のビットコイン空売りで270万ドルの損失
リミットレスがLMTSトークンエコノミクスを発表、エアドロップとインセンティブが24.37%を占める
関連記事
シェア
上昇率上位
最新暗号資産ニュース
16:46
既存のアルトコインは全体的に上昇したが、ストレージおよびプライバシー分野のトークンは独立した価格変動を示した。
16:22
U.S. October New York Fed 1-Year Inflation Expectation is 3.24%, down from the previous value of 3.38%.
16:16
米国の消費者信頼感は3年以上ぶりの最低水準に落ち込み、労働市場も引き続き弱まると予想されている。
16:16
CryptoQuant: BTCの新規需要は縮小しており、長期保有者の売却が市場に吸収されていない。
15:47
ZEC は上昇傾向を続け、700 ドルに達し、史上最高値を更新しました。
もっと見る