- خرید رمز ارز
- بازارها
- فیوچرز
- اسپات
- کپی ترید
 WE-Launch
Historical B/S Indicators for Candlestick Charts
By: WEEX|2025/10/22 10:17:20
WEEX just got smarter! Review past trades and refine your strategies with our brand-new feature: Historical B/S (Buy/Sell) markers for candlestick charts! Now, you can view your past trades right on the chart, helping you make sharper decisions and trade more efficiently.
Highlights
- Trade records at a glance
- Your Buy (B) and Sell (S) points are automatically marked on the chart.
- Each marker shows your precise trade time and price, helping you review past orders at a glance.
- Comprehensive coverage
- Spot trading: Full support for marking trades across all spot pairs.
- Futures trading: Clearly shows open and close points, distinguishing between long and short positions.
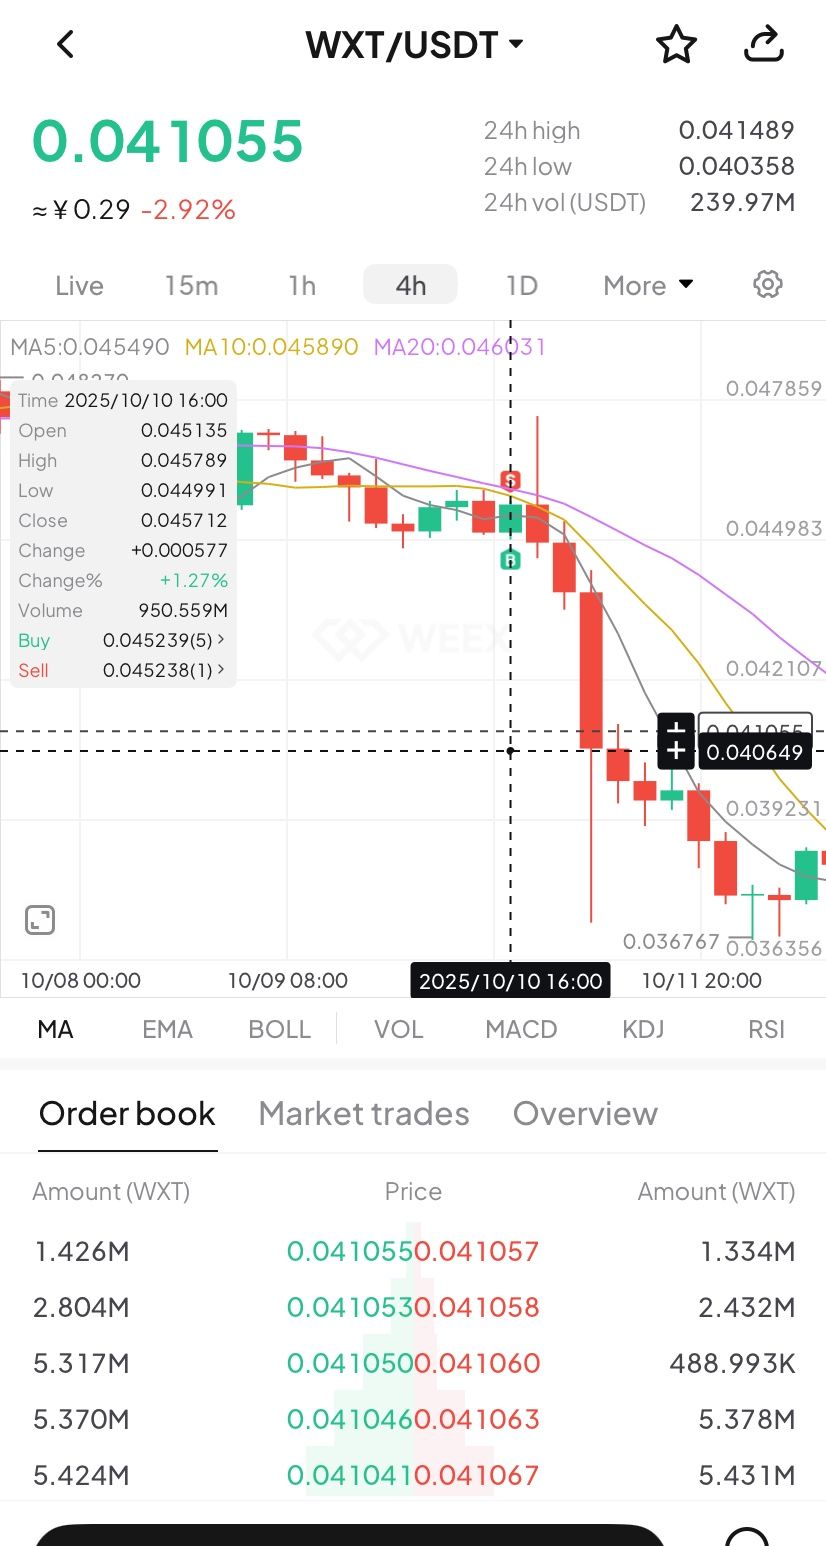
- Rich interactions
- Tap any marker (B or S) to view detailed trade information, such as:
- Trade time: Review exact trade times and corresponding market conditions.
- Execution price: Displays the average filled price of historical trades.
- Trade count: Quickly check the number of trades in a certain period.
- Markers update dynamically as you zoom and drag the candlestick. Seamlessly review up to 100 executed trades from the last 90 days.
- Universal access
- Available on both iOS and Android: Access your trade history anytime, on any mobile device.
- Full currency coverage: Supports all pairs in your portfolio, across both spot and futures markets.
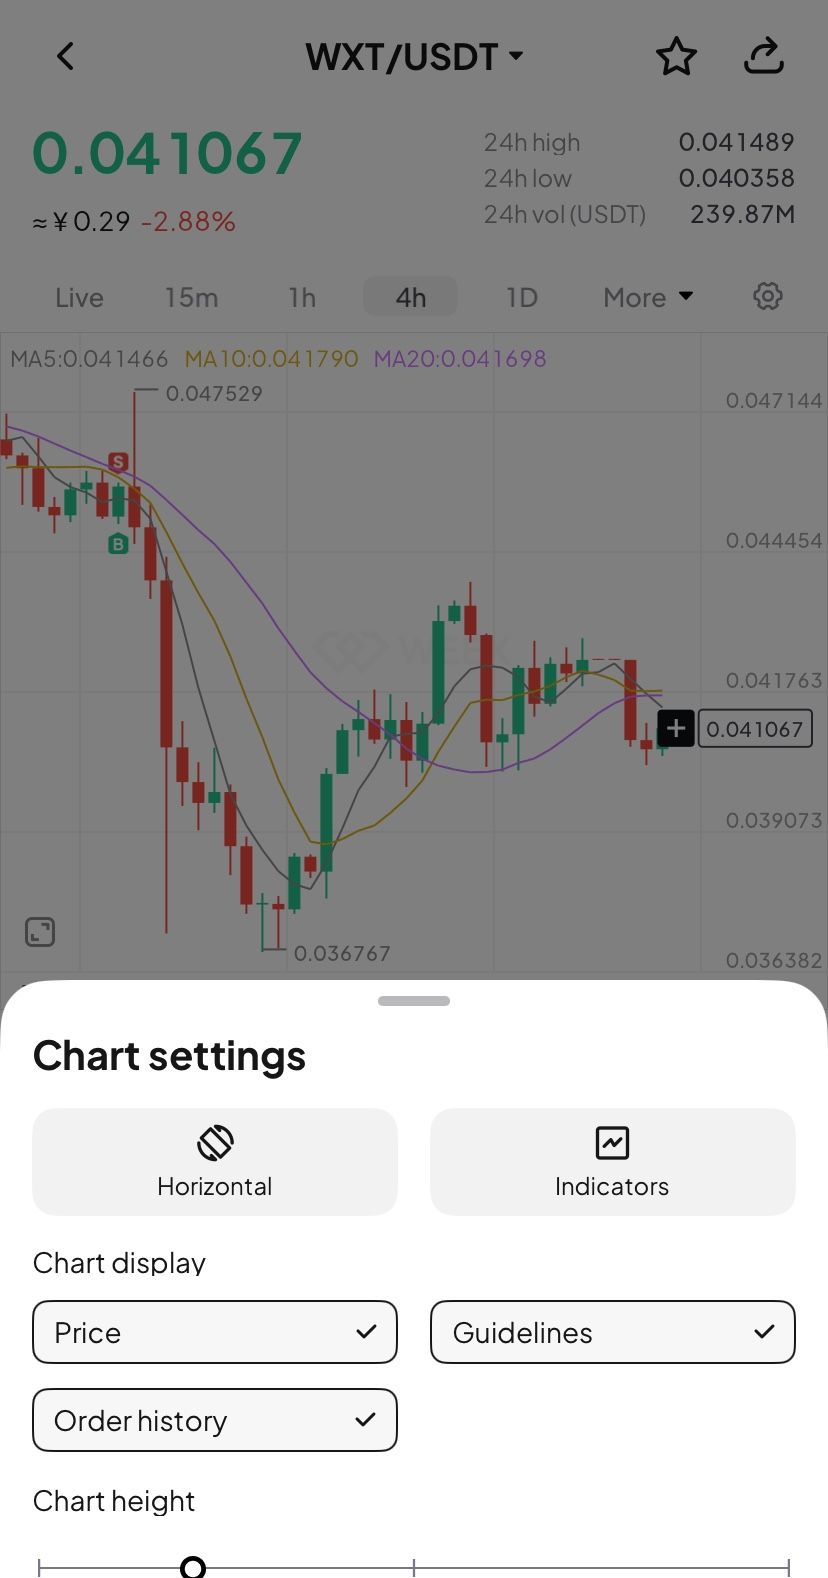
How to Use?
- Open the WEEX app and go to any pair's chart page.
- Tap the candlestick chart and enable the "Order history" feature in the chart settings (enabled by default.)
- If trades exist for that pair, B and S markers will instantly show up on the chart.
- Tap any marker to check the full details of that transaction.
Where to use it
- Review strategies: Quickly review your buy and sell points combined with market trends to refine your strategy.
- Analyze PnL: Easily pinpoint profitable or losing trades to learn from your past performance.
Understand trends: Combine your trade history with the candlestick chart data for deeper market and behavioral analysis.
Feature preview
- On/off toggle: Use the "Settings" icon to switch the "Order History" feature on or off (enabled by default).
- B (Buy) marker: Green marker showing your exact buy action.
- S (Sell) marker: Red marker identifying every sell transaction.
- Details pop-up: Tapping the marker brings up a card with key data (time, price, and count).
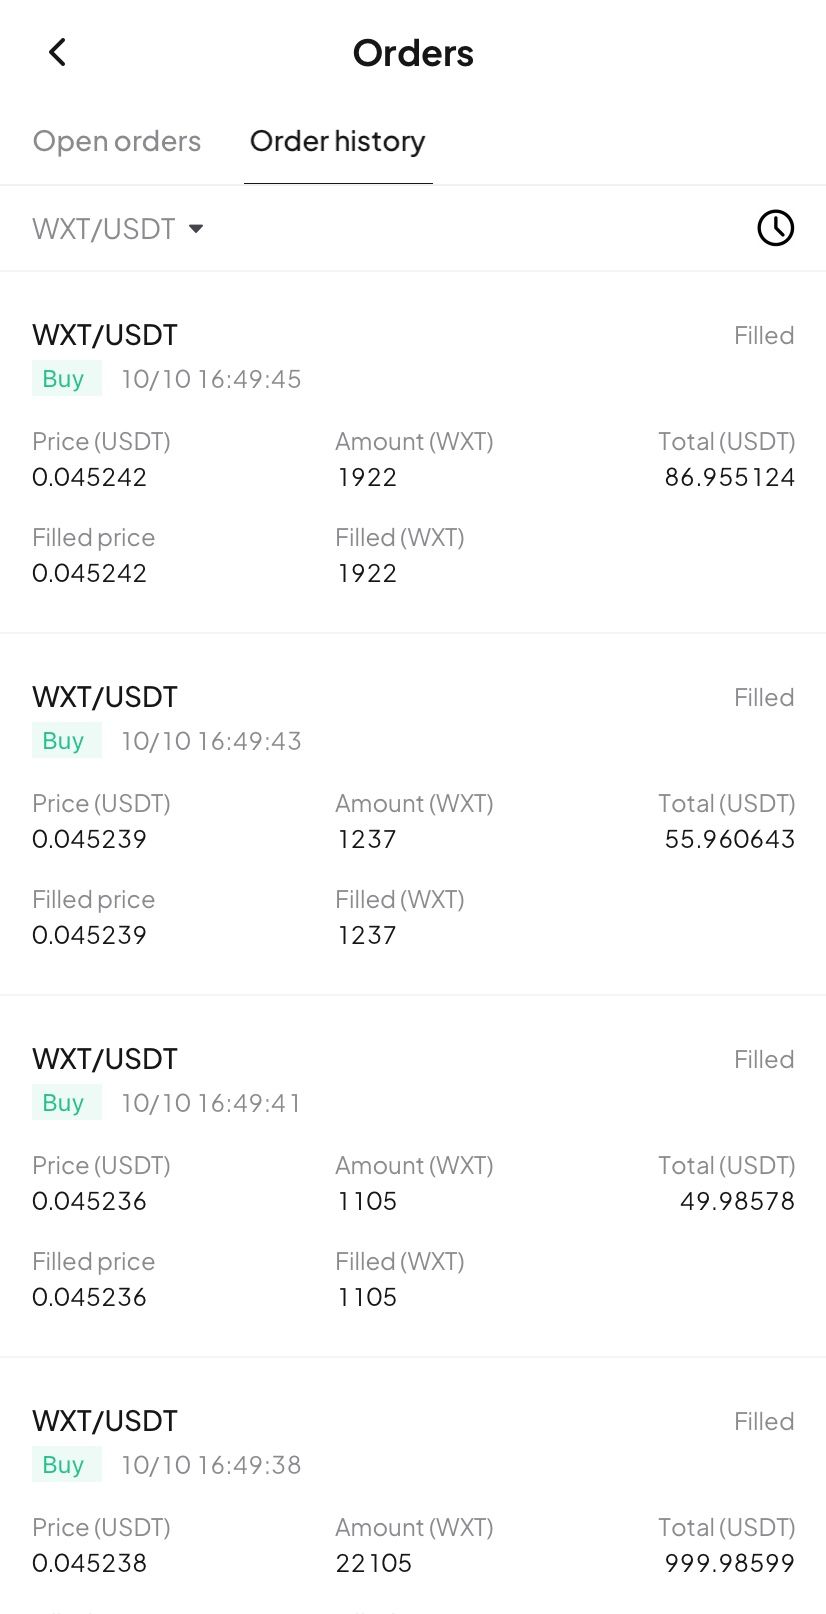
- Full breakdown: Tap the details card to open the "Order History" page and view your trading record.
Try now
Update your WEEX app to the latest version to experience our new Buy/Sell markers! Gain clarity and transparency in your trades, empowering smarter investment decision!
اگر quantum computers قبلاً Bitcoin را شکسته باشند چه؟
فدرال رزرو در حال بررسی حسابهای پرداخت “skinny” برای دسترسی fintech و crypto به سیستم پرداخت
ممکن است شما نیز علاقهمند باشید
اشتراکگذاری
سوددهها
آخرین اخبار رمز ارز
14:21
صندوق پوشش ریسک ارزهای دیجیتال Lantern Ventures به تدریج منحل میشود و وجوه به سرمایهگذاران خارجی بازگردانده میشود
14:19
هشدار امنیتی: اپلیکیشن جعلی Hyperliquid در فروشگاه گوگل پلی پیدا شد
14:17
تِدِر برای اولین بار کرسی هیئت مدیره باشگاه یوونتوس را به دست آورد
13:57
نگهدارنده: ناامید از کاهش نرخ بهره فدرال رزرو، فدرال رزرو ممکن است به ابزاری حزبی تبدیل شده باشد.
13:55
خزانهداری USDC در ۲۴ ساعت گذشته در مجموع ۱.۲۵ میلیارد USDC در زنجیره Solana ضرب کرده است.
ادامه مطلب
جامعه
پشتیبانی مشتری:@weikecs
همکاری تجاری:@weikecs
معاملات کمّی و بازارسازی:bd@weex.com
خدمات VIP:support@weex.com