- شراء عملات مشفرة
- الأسواق
- العقود الآجلة
- تداول فوري
- نسخ التداول
 WE-Launch
Historical B/S Indicators for Candlestick Charts
By: WEEX|2025/10/22 10:17:20
WEEX just got smarter! Review past trades and refine your strategies with our brand-new feature: Historical B/S (Buy/Sell) markers for candlestick charts! Now, you can view your past trades right on the chart, helping you make sharper decisions and trade more efficiently.
Highlights
- Trade records at a glance
- Your Buy (B) and Sell (S) points are automatically marked on the chart.
- Each marker shows your precise trade time and price, helping you review past orders at a glance.
- Comprehensive coverage
- Spot trading: Full support for marking trades across all spot pairs.
- Futures trading: Clearly shows open and close points, distinguishing between long and short positions.
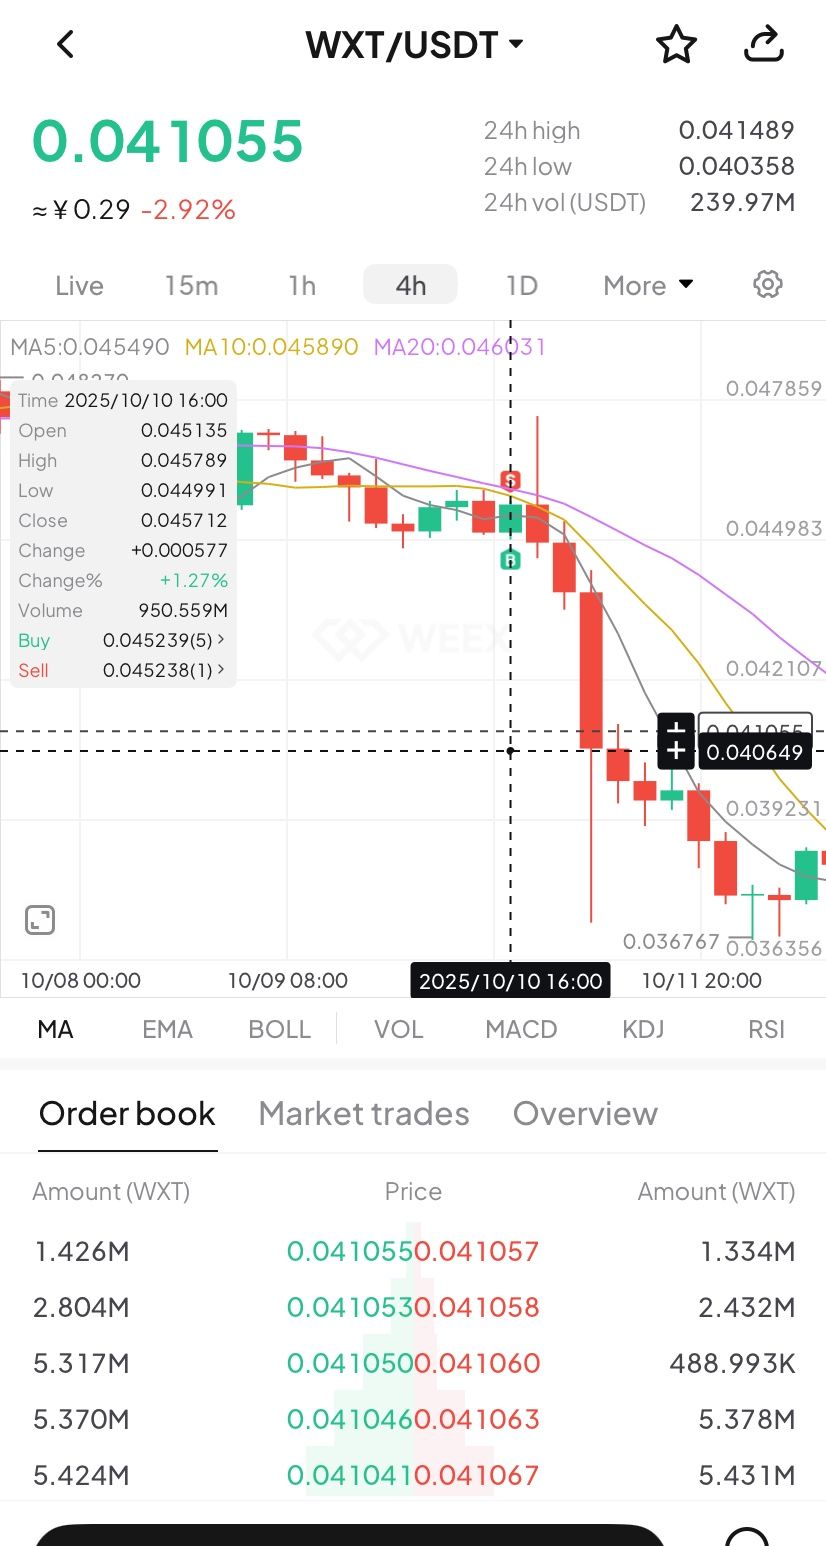
- Rich interactions
- Tap any marker (B or S) to view detailed trade information, such as:
- Trade time: Review exact trade times and corresponding market conditions.
- Execution price: Displays the average filled price of historical trades.
- Trade count: Quickly check the number of trades in a certain period.
- Markers update dynamically as you zoom and drag the candlestick. Seamlessly review up to 100 executed trades from the last 90 days.
- Universal access
- Available on both iOS and Android: Access your trade history anytime, on any mobile device.
- Full currency coverage: Supports all pairs in your portfolio, across both spot and futures markets.
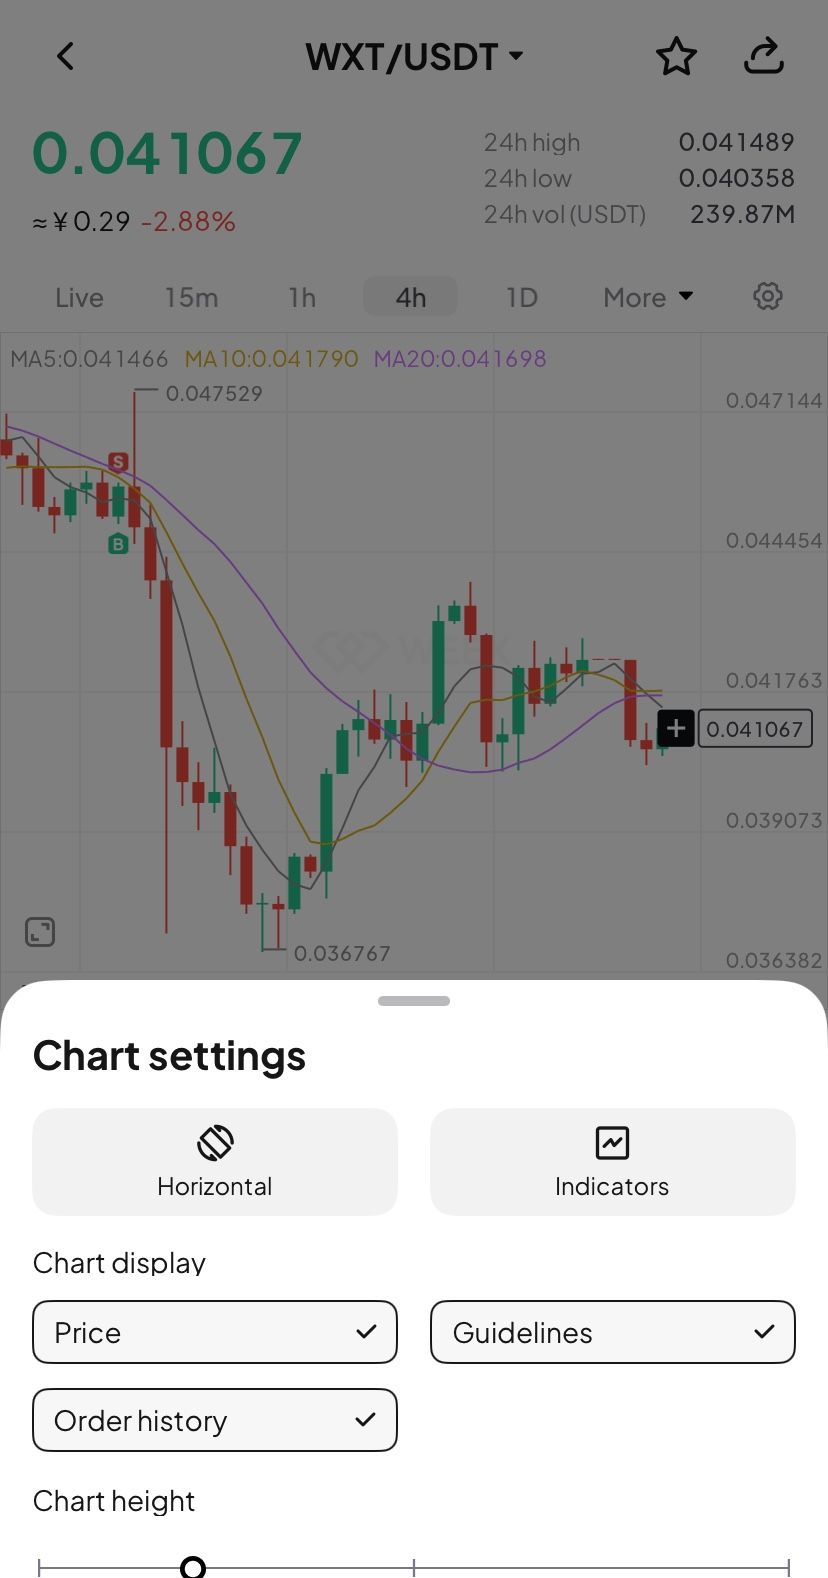
How to Use?
- Open the WEEX app and go to any pair's chart page.
- Tap the candlestick chart and enable the "Order history" feature in the chart settings (enabled by default.)
- If trades exist for that pair, B and S markers will instantly show up on the chart.
- Tap any marker to check the full details of that transaction.
Where to use it
- Review strategies: Quickly review your buy and sell points combined with market trends to refine your strategy.
- Analyze PnL: Easily pinpoint profitable or losing trades to learn from your past performance.
Understand trends: Combine your trade history with the candlestick chart data for deeper market and behavioral analysis.
Feature preview
- On/off toggle: Use the "Settings" icon to switch the "Order History" feature on or off (enabled by default).
- B (Buy) marker: Green marker showing your exact buy action.
- S (Sell) marker: Red marker identifying every sell transaction.
- Details pop-up: Tapping the marker brings up a card with key data (time, price, and count).
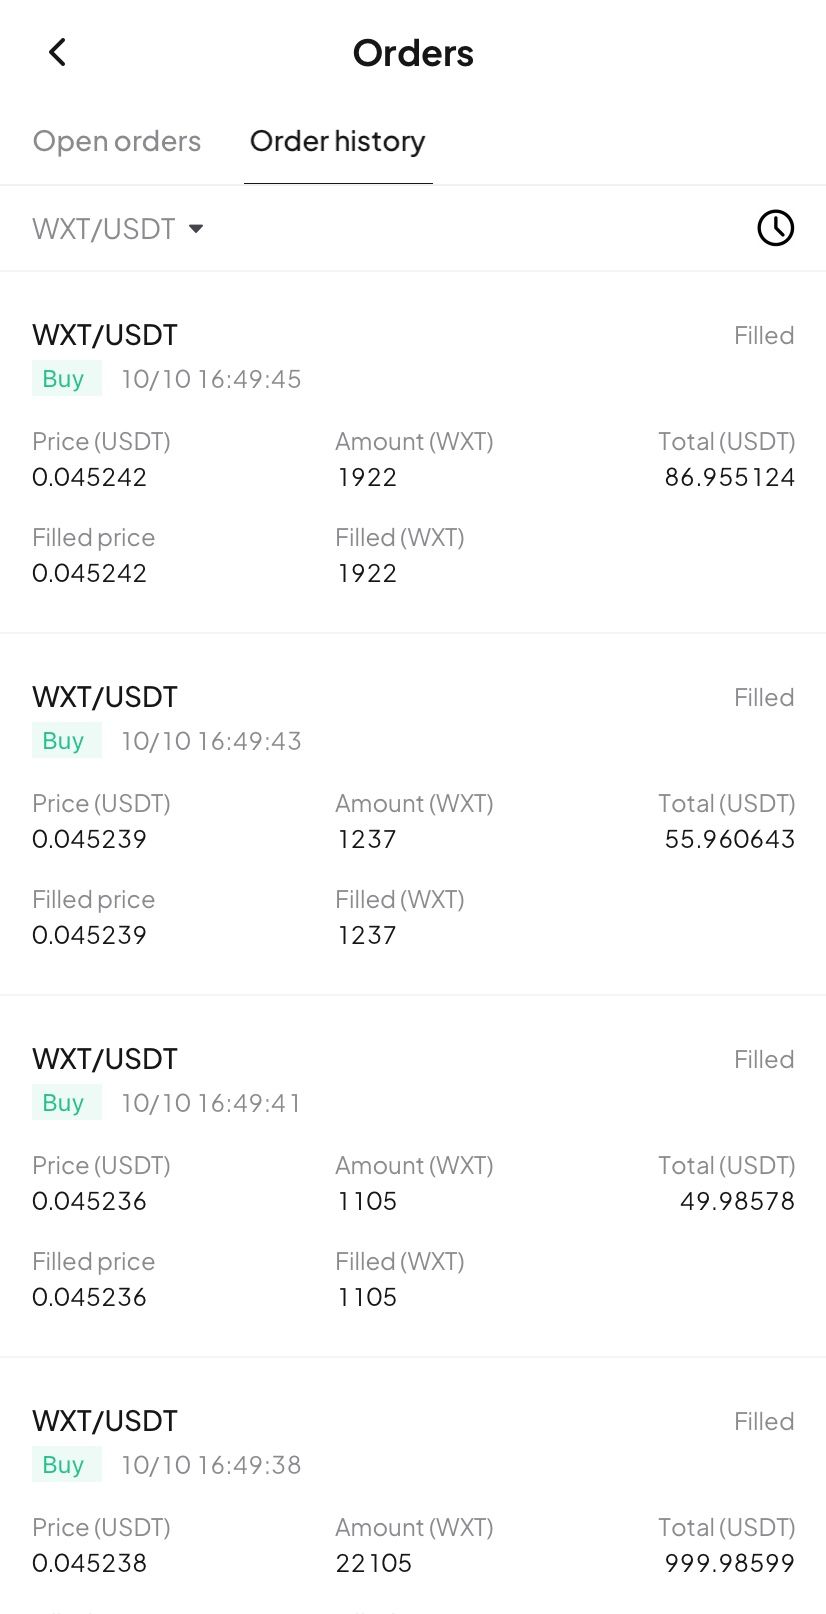
- Full breakdown: Tap the details card to open the "Order History" page and view your trading record.
Try now
Update your WEEX app to the latest version to experience our new Buy/Sell markers! Gain clarity and transparency in your trades, empowering smarter investment decision!
يمكن أن يرتفع Ether مثل عام 2021 مع استعداد متداولي SOL لانخفاض بنسبة 10%: أسرار التداول
Fed يفكر في “skinny” payment accounts لفتح الطرق أمام fintech والشركات الصغيرة
قد يعجبك أيضاً
مشاركة
الرابحون
أحدث أخبار العملات المشفرة
13:34
بافيل دوروف: تيليجرام تطلق Cocoon، شبكة الحوسبة الآمنة المفتوحة، في نوفمبر
13:32
العد التنازلي لمزاد RIVER العام لمدة ساعة واحدة: اشتراك BNB مفتوح خلال 48 ساعة، استرداد الأموال بأقل سعر في المزاد
13:29
معاينة قرار بنك الاحتياطي الفيدرالي: قد يتضمن بيان السياسة تعديلات على الأقسام التالية
13:27
معاينة اجتماع بنك الاحتياطي الفيدرالي: قد يُحدث المؤتمر الصحفي مفاجأةً كبيرة
13:25
"حوت ذو معدل فوز ١٠٠٪" يستثمر طويل الأجل في SOL بحجم مركز يتجاوز ١٠٠ مليون دولار
قراءة المزيد
المجتمع
دعم العملاء:@weikecs
التعاون التجاري:@weikecs
التداول الكمي وصناع السوق:bd@weex.com
خدمات (VIP):support@weex.com